

SharePoint Diagnostic Tools
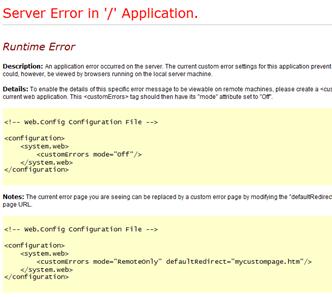
You know the story: you make some innocuous change to some page in your site, or worse, the master page, and suddenly you are confronted with an error message or the Yellow Screen of Death:
So here is a quick run-down of the changes you need to make to your farm, and the things you should be looking for, in order to get SharePoint back into tip-top condition.
Change your web.config to give a more helpful error page
The YSOD actually comes from ASP.NET rather than SharePoint, and inidicates something is fundamentally wrong with rendering of the page. In your web root (usually something like C:\\inetpub\\wwwroot\\wss\\VirtualDirectories\\80) change your web.config to show more helpful error messages. First find the <CustomErros> element and change its mode to Off. Then find the <comilation> element and add an attribute "debug" and set it to true. Finally, set the CallStack attribute of the <SafeMode> element to true also. Your web.config should look something like the following:
  <SharePoint>
    <SafeMode MaxControls="200" CallStack="true"
    DirectFileDependencies="10" TotalFileDependencies="50"
    AllowPageLevelTrace="false" />
    .....
  </SharePoint>
  <system.web>
    .....
    <customErrors mode="Off" />
    .....
    <compilation batch="false" debug="true"optimizeCompilations="true" />
    .....
  <system.web>
If you are getting errors on application pages you will also need to make similar changes to the web.config file that lives in your SharePoint root folder. This is usually found at C:\\Program Files\\Common Files\\Microsoft Shared\\Web Server Extensions\\14\\TEMPLATE\\LAYOUTS. You won't need to worry about modifying the CallStack attribute on this web.config file because there won't be a <SafeMode> element - application pages are not compiled in safe mode. Just make the changes to the <customErrors> and <compilation> elements.
Be very careful about doing this on a live production server. If it is humanly possible do your troubleshooting work on a test server. If you must do this on a live server, be sure to return these settings back to the original values when you have finished. If you leave these settings you don't just risk acquiring some baffled users; you also risk leaking information that could be used by a hacker to compromise your site.
Enable the Developer Dashboard
It might not help you if your page is completely crashing and burning, but when you get a slow page or error messages within an otherwise rendering page, the Developer Dashboard can be your friend, even if you are not a developer.
To enable the developer dashboard you need to use stsadm. "Wait", you say, "stsadm is old school - you should use PowerShell". Well, you can use PowerShell for this, but frankly, the stsadm method is a lot easier, and stsadm is going to be around for a while. The command you need to run just sets a property:
stsadm -o setproperty -pn developer-dashboard -pv ondemand
To switch it off again (globally) you use:
stsadm -o setproperty -pn developer-dashboard -pv off
Once enabled, and provided you have administrator privileges, you will see a small icon at the top right of every page. When you click on this you enable a block of diagnostic information at the bottom of that page, including the time to render each web part on the page, and what database queries were executed in order to render the page. It is a toggle, so you can disable it again, and the toggle state applies to that particular page.

Trace Logs
The trace logs are saved to the LOGS directory in the SharePoint root folder, usually C:\\Program Files\\Common Files\\Microsoft Shared\\Web Server Extensions\\14\\LOGS. In there you will find a large number big files with names consisting of the server name and date. As well as containing information about each logged event, each entry has a Correlation ID. This ID is unique to each server transaction, and is usually reported in any error message, allowing you to quickly identify log entries that correspond to a particular error condition.
The log files are quite unwieldy to analyse, so the normal practice is to use a tool such as ULSViewer (available on Codeplex). This tool can be run against existing log files, or can be set to capture the current logging output and filter it by, for example, the Correlation ID.
The precise information that is logged can be controlled from Central Administration. Go to the Monitoring section and then Reporting->Configure Diagnostic Logging. This takes you to a page where you can exact fairly fine-grained control over what will get logged.
Normally you will increase the logging level while analyzing a problem. Don't forget to set it back to the default levels when you have finished (easily accomplished with the Reset to Default setting), otherwise you will continue collecting a great deal of data that will slow down the server and possibly fill the disks.
Health Analyzer
 The Health Analyzer is a configuration tool which comes pre-populated with a set of rules based on "best-practices" and common configuration errors. "Best Practices", "Guidelines" and "Knowledge Transfer" are buzz-words for what we have nowadays to replace the old-fashioned process of somebody showing you how to do something. Now you don't even have to go to a conference or a training course - the Health Analyzer timer job periodically gives your farm a quick once-over to make sure everything is still hunky dory.
The only problem is that, like so many best practices, it doesn't always apply. So a good idea is to either fix the problems at the outset, or disable those rules that are either not important or not applicable. Otherwise you get used to those red or amber warning bars in Central Administration. By ensuring that the Health Analyzer gets your attention, you stand a chance of spotting an impending problem before it turns into a crisis.
Although the built-in rules are a bit limited at present, you can expect more rules with service packs and the next release, so this tool will probably become increasingly important and useful.
Windows Event Logs
With the analysis power of the ULS logs at our fingertips, we often forget to look in the Windows logs. But it is always worth a quick check to see if there is anything untoward, particularly in the Application log. This is where you will see SQL database access errors caused when one of your service accounts doesn't have the right permissions, which is a common cause of misery when setting up SharePoint.
Remember that in larger farms you may need to check these on more than one machine (unlike the logging database). It is quite easy to look at the logs on just one of your web front-end server, only to find that the problem requests were being sent to another server by the load-balancer.
Fiddler
When you are debugging on the client (usually a browser) you sometimes get into situations where there is nothing happening on the server at all, or the server responds with a frosty 401 error. When this happens the best tool to diagnose the problem is Fiddler. This is an HTTP traffic analyzer that shows you each request and response. This is especially useful for dealing with problems with authentication and the inconsistent responses you get with proxies and caching.
SPDiag
Microsoft SharePoint Diagnostic Studio 2010 (SPDiag version 3.0) is a troubleshooting tool that is part of the SharePoint Administration Toolkit from Microsoft. It is designed to provide a unified view of data collected from your SharePoint farm, and to identify performance issues. It can also be used to capture information to be share or export the collected data and in the form of reports that can be sent for analysis by Microsoft support or other consultants. It is particularly useful for complex multi-server farms where it enables you to roubleshoot SharePoint 2010 problems without needing to manually collect all the data from the various servers.
The SPDiag tool can be downloaded from Microsoft.
Netmon
Microsoft Network Monitor is a protocal analyzer that allows you to capture network traffic and analyze it. This is useful for hardcore analysis of server traffic, and particularly useful for looking at data traffic to and from the database.
The Microsoft Network Monitor tool can be downloaded from Microsoft.